Submitted Documents Widget
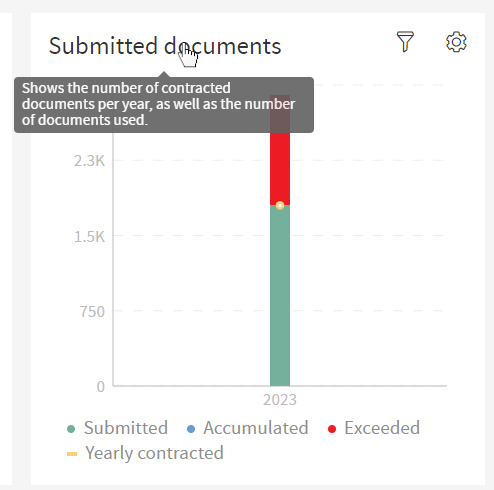
This widget shows the number of contracted documents per year, as well as the number of documents used.
The user can hover the mouse over the title to see a brief explanation of what the widget is.
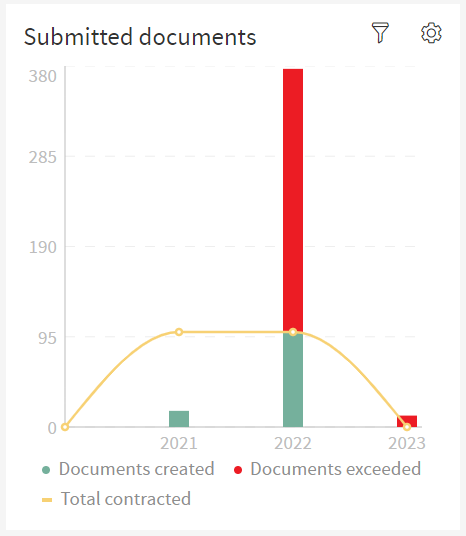
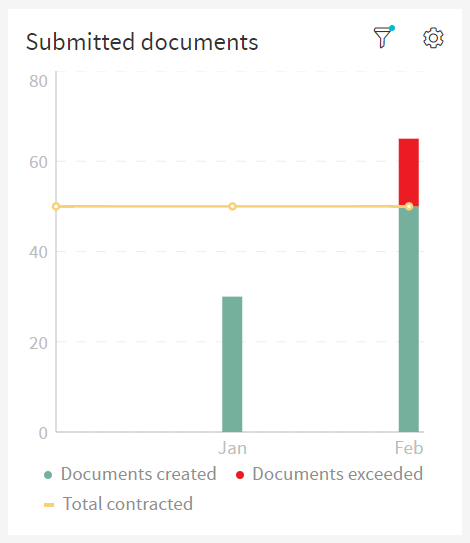
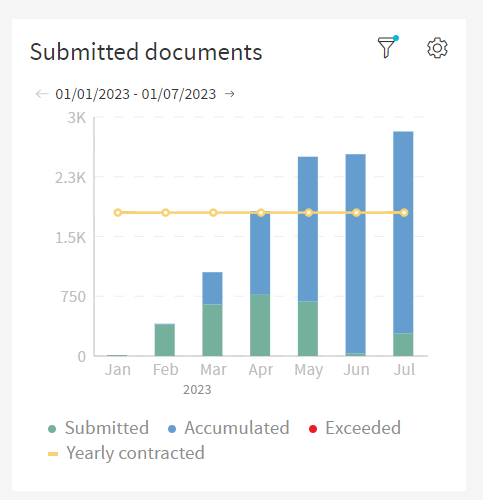
This widget has both a Bar Chart and a Line Chart combined to display its information. The Bar Chart illustrates the number of documents used, while the Line Chart shows the total amount of documents.
At the bottom of the widget, there is a legend explaining what each element of the chart means.
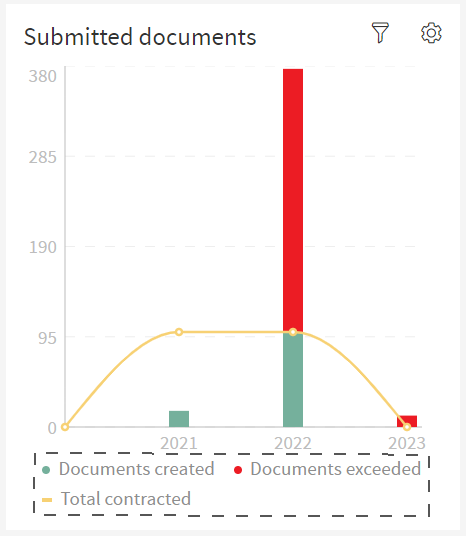
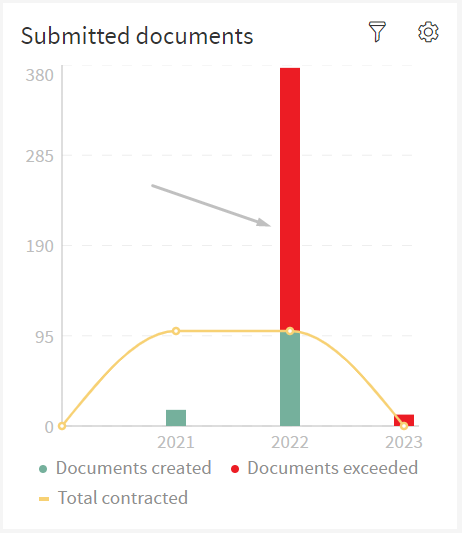
The bars on the chart represent the amount of documents created and exceeded, only if a bar goes past the line, does it mean there are exceeded documents, this will create a stacked bar.
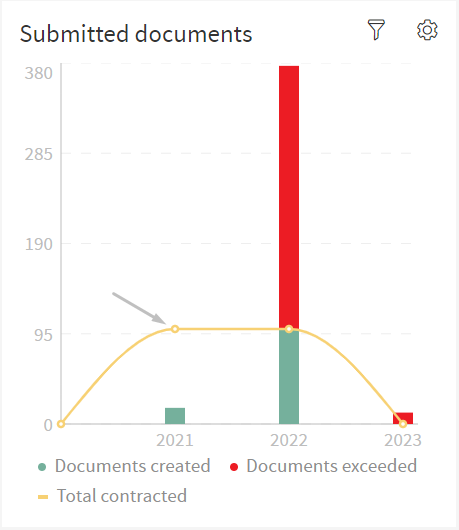
The line on the Chart has dots, each of these dots represents the total number contracted in a selected period in time.
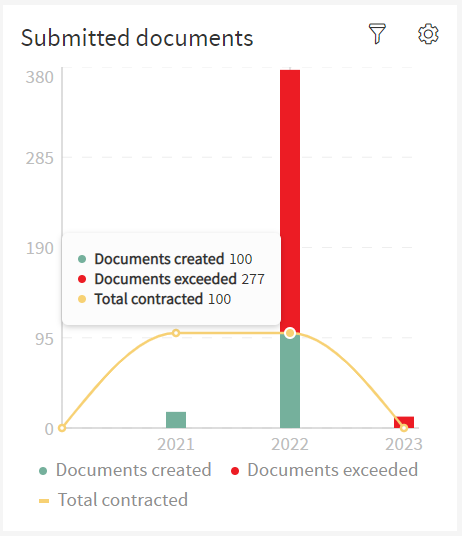
The user can hover over these dots to display a tooltip with the exact number of documents created, documents exceeded and total contracted associated with that date period. Hovering will also create a vertical line going through the dot and it will fill the inside of it to further accentuate the option the user is selecting.
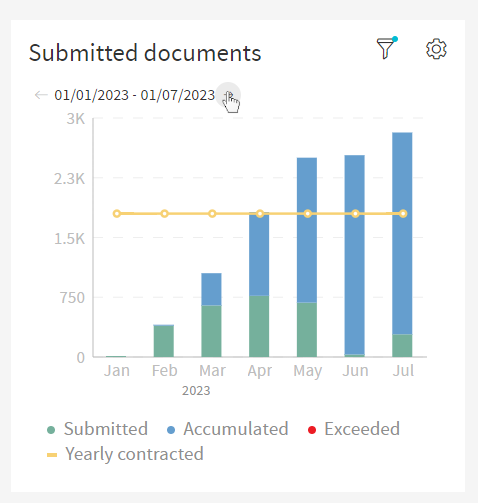
If the user applied the partition filter, the widget will display information like so.
| The partition selected was "month" in the date range of 1992 of a specific dataset |
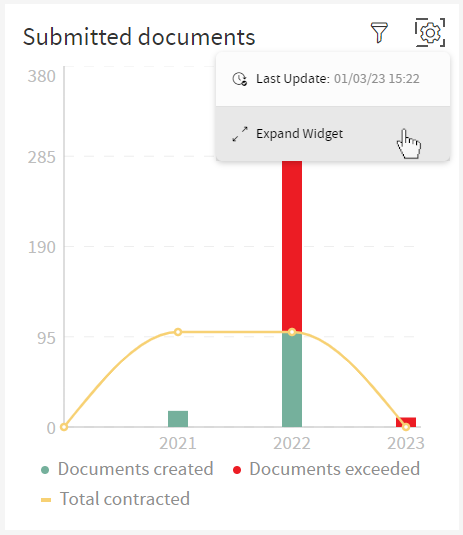
To enter fullscreen, click on the cog wheel on the top right of the widget and you’ll enter a settings menu, here click on the option that says "Expand Widget".
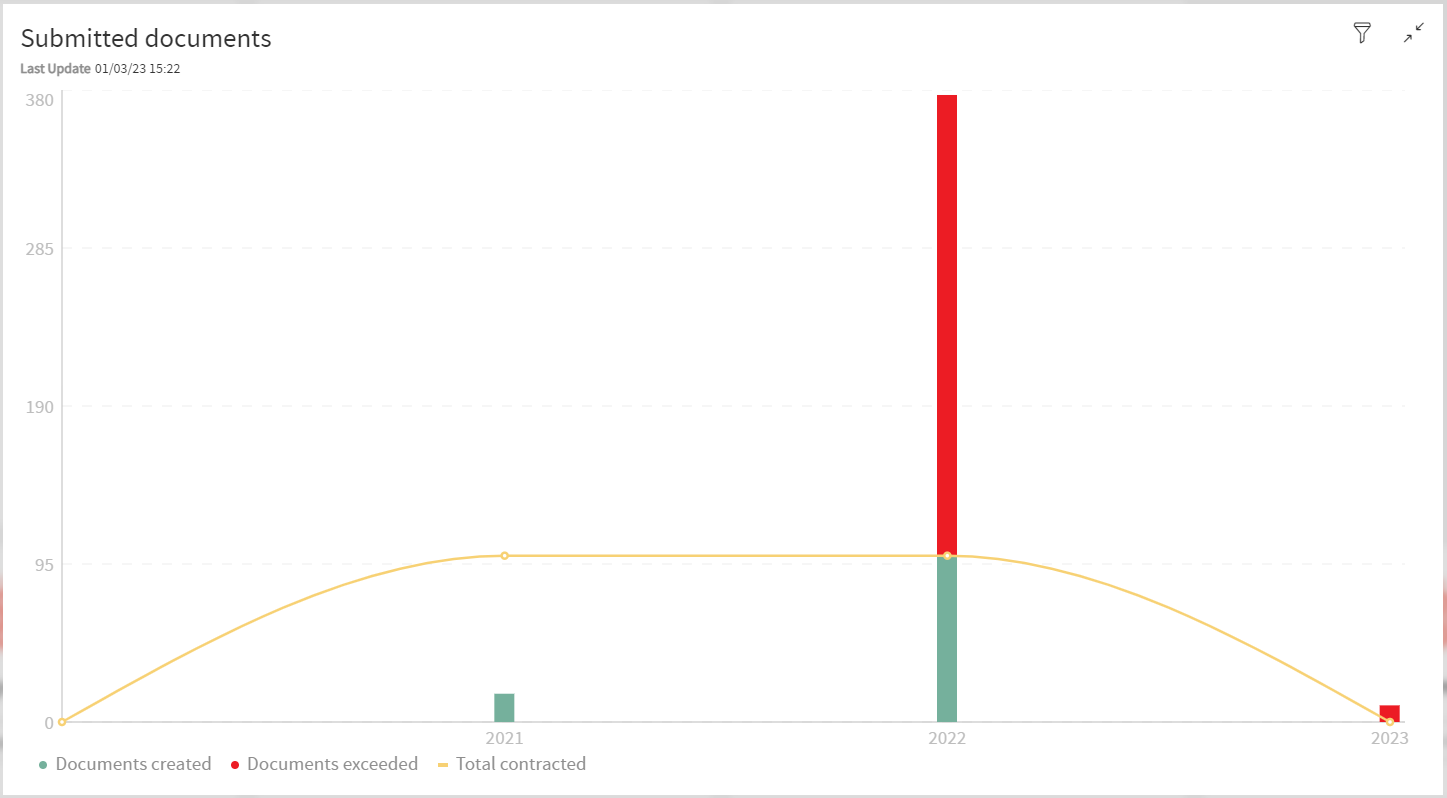
When the widget is in fullscreen, it displays the information in this way.
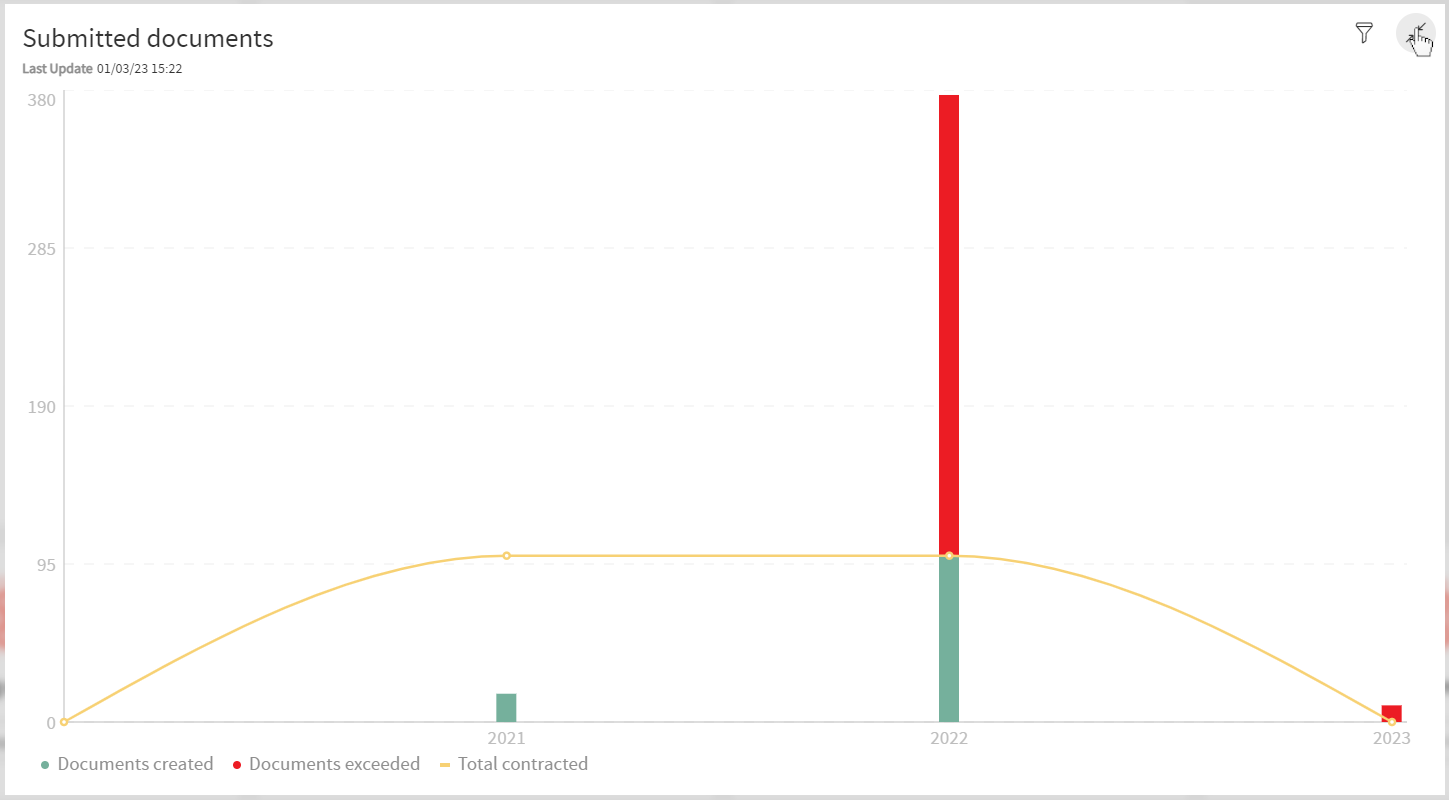
To return to default view, click the icon on the top right to exit fullscreen.
Partitioning
The widget will display a partitioned chart is selected (In this case, the partition of Month with the default date range has been applied).
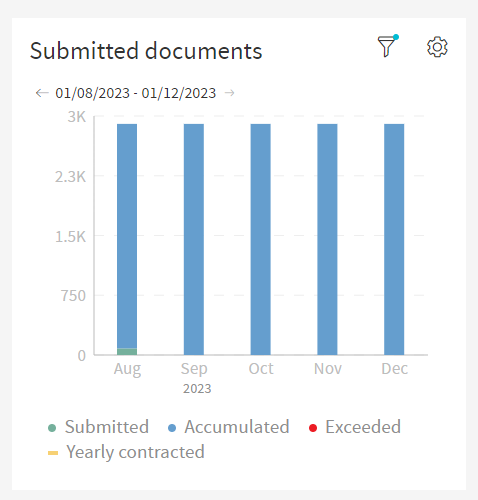
Since the there is too much to display on the widget, there are arrows on the top left of the widget that allow the user to see the rest of the data by clicking said arrows.