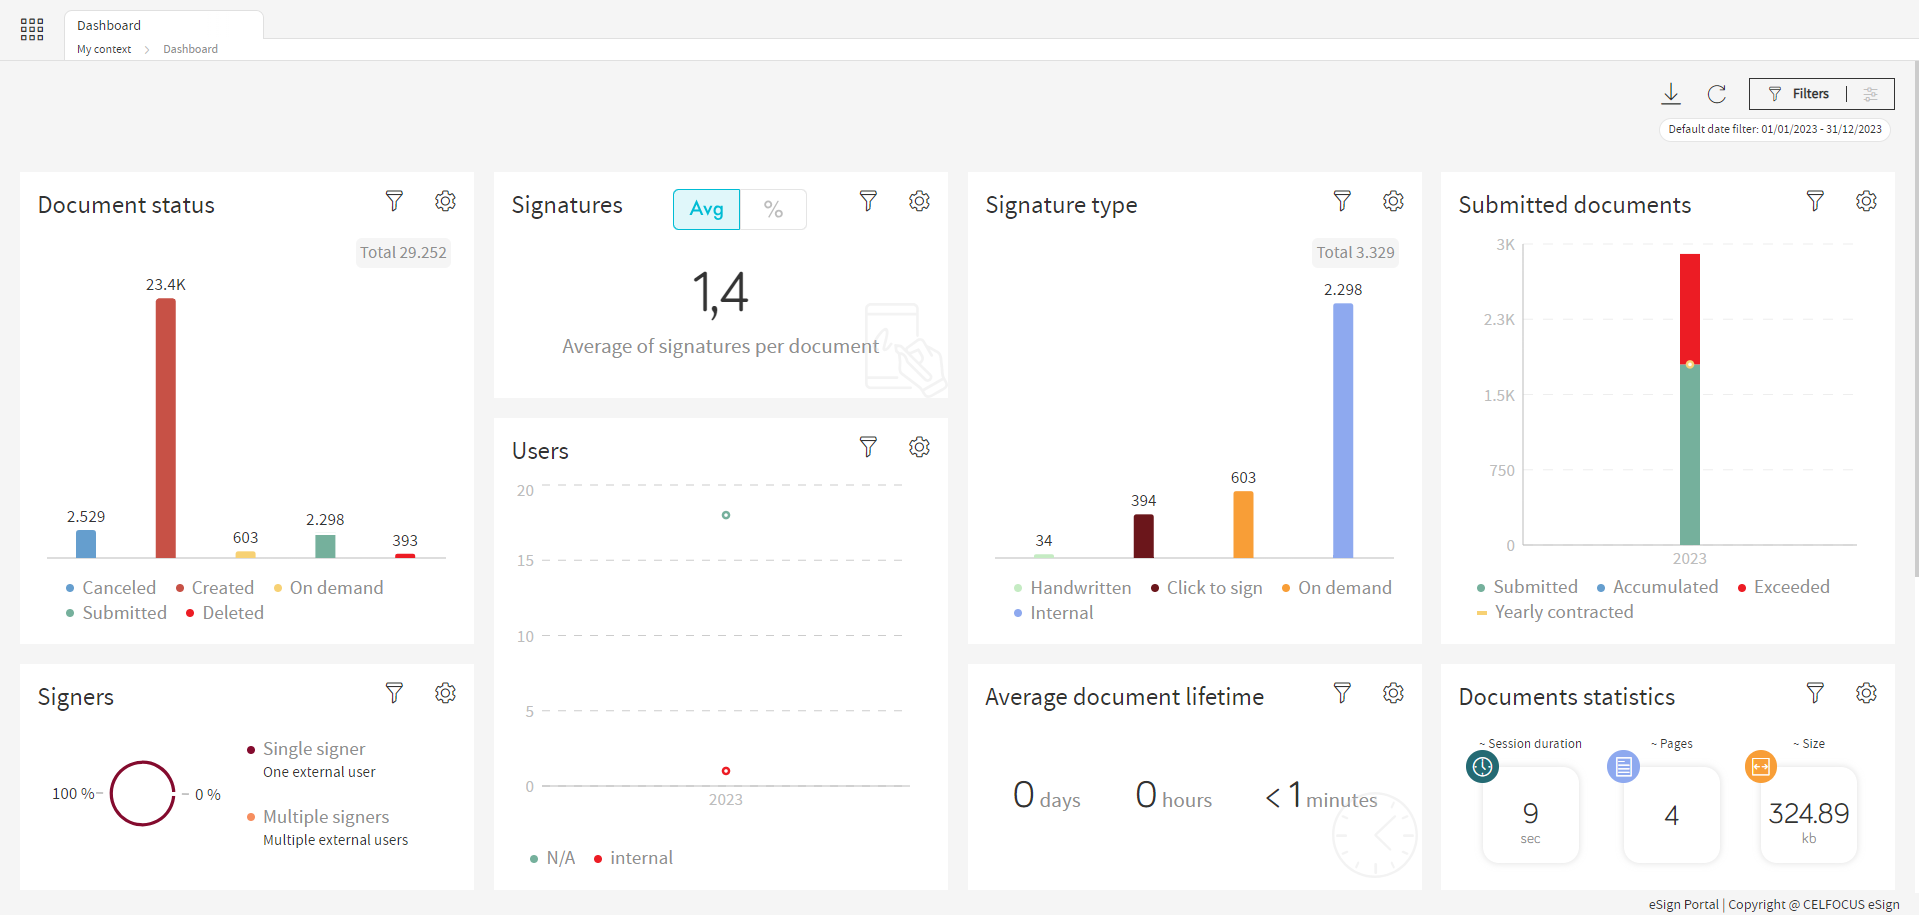
Analytics Dashboard
This dashboard is the default process for the eSign portal, here the user will be able to see different statistics for the eSign platform.
| Everything in this dashboard needs specifics entitlements to be shown, there may be users without access to everything shown here. |
Last update date
The user can see when the data of each widget was fetched, simply by pressing the menu icon on the widget.
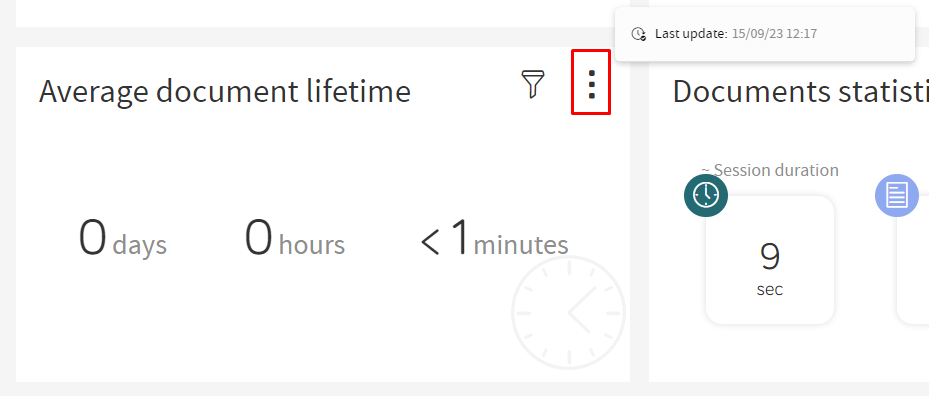
| If a filter is applied to the widget this option will be disabled. |
Filtering Data
You can filter the statistics shown on screen using two different methods.
Dashboard Toolbar
Using this method every widget will suffer from the filter chosen.
| By default there is a date range filter applied of the current year. |
| If a widget has a a filter applied the dashboard filters of the same type will be overridden. |
Date Filter
This filter will restrict the date shown on the dashboard to the specified date interval.
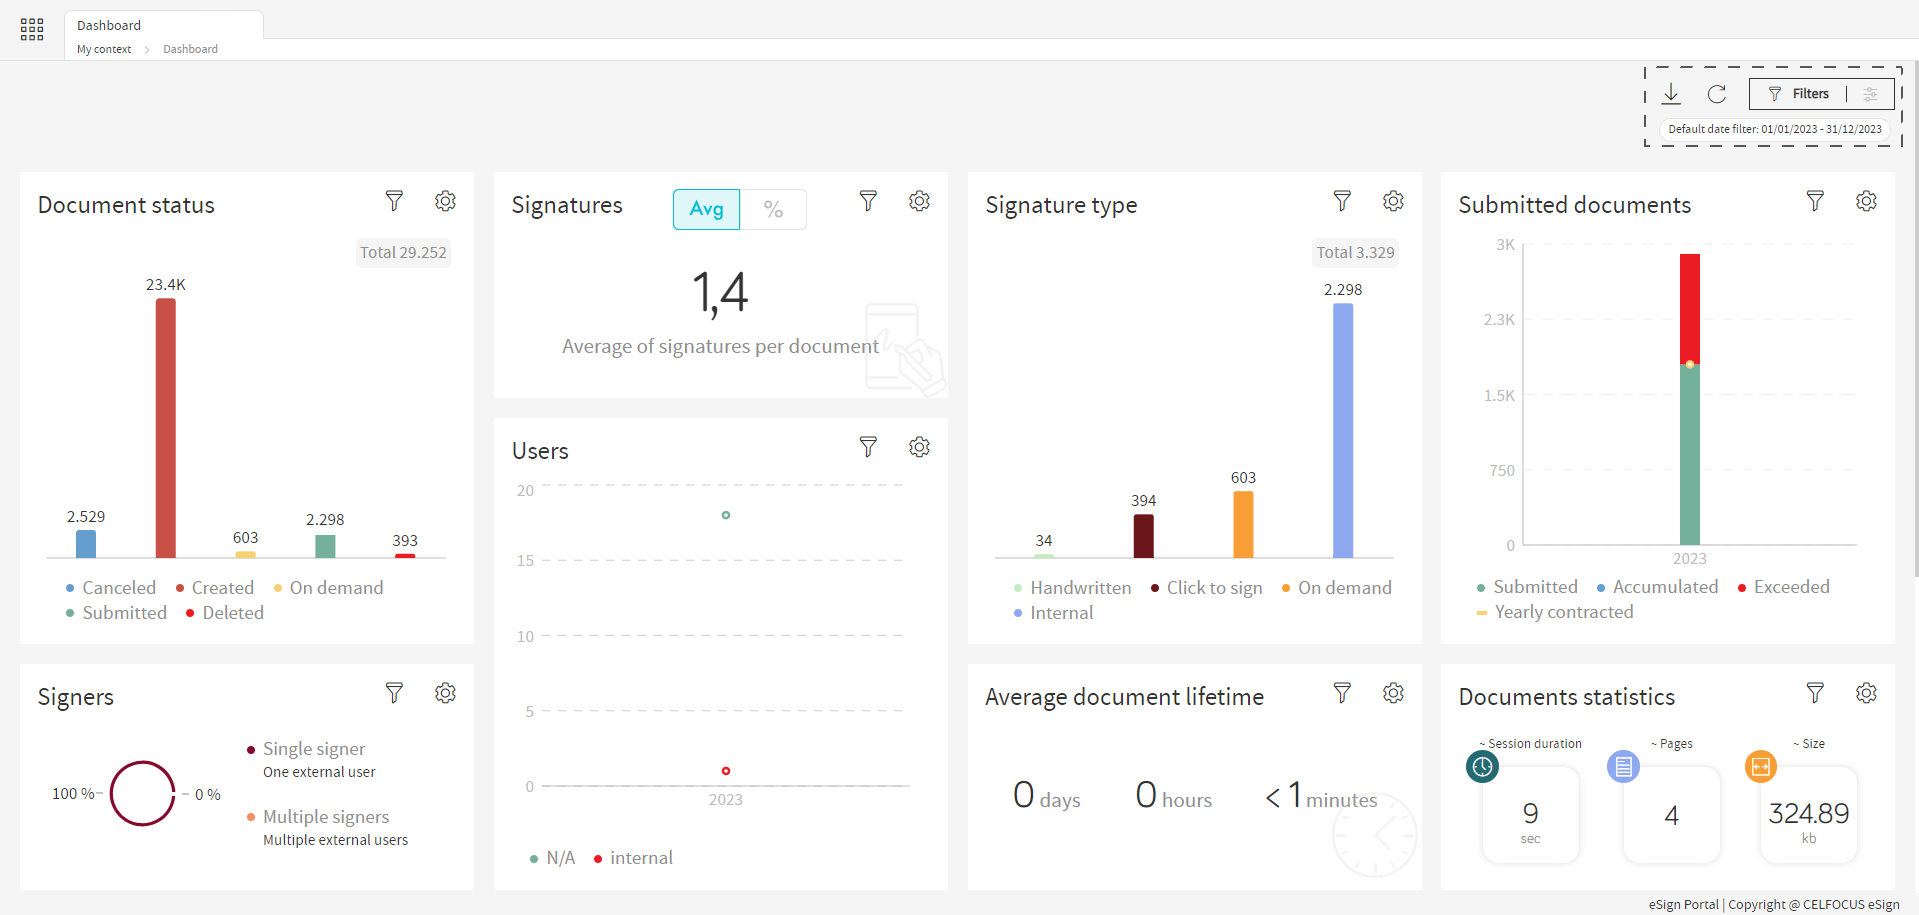
To filter by date, press the filters button like the image below shows.

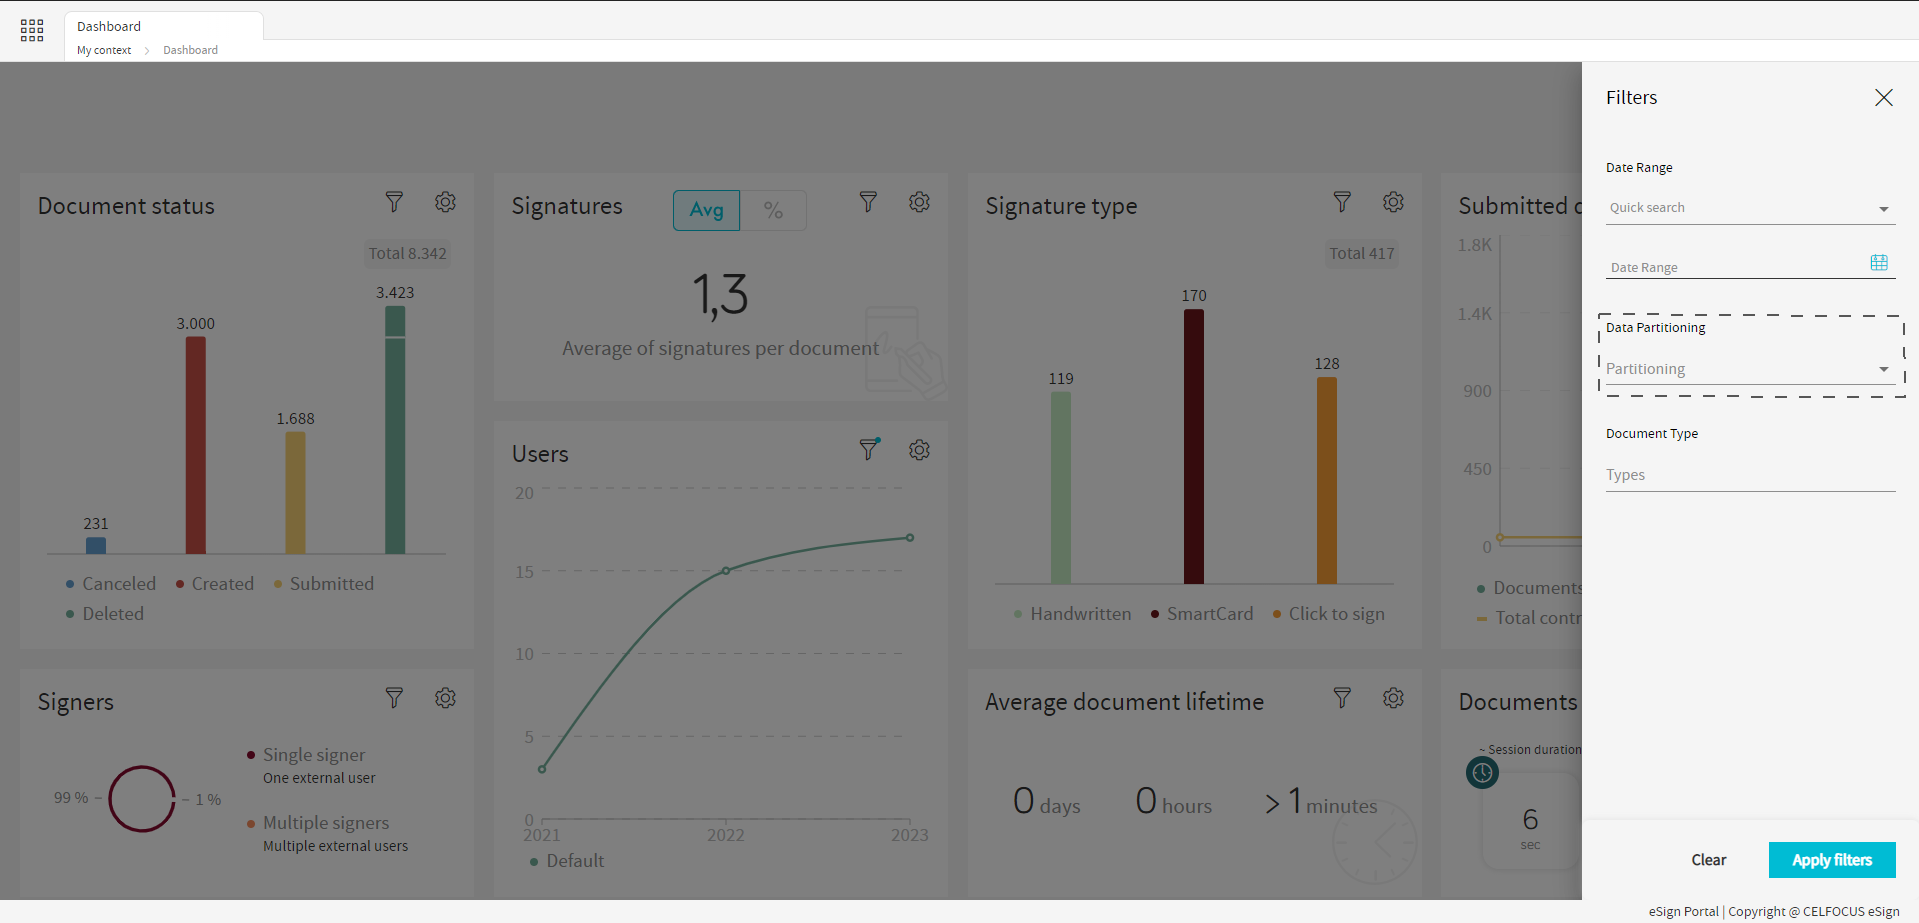
On the newly open sidebar you will be able to select a date by a dropdown selector with a couple of default options or by selecting a custom data range on the calendar.

After selecting the desired date range, press the apply filters button.
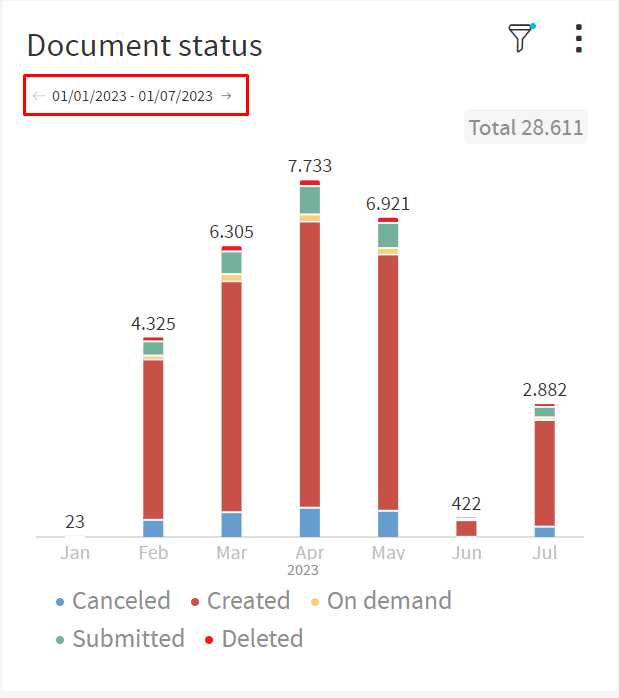
Now the dashboard will only show data relative to that time frame, you can see if a filter is applied by the filters chip.

Document Type Filter
This filter will restrict the statistics on the dashboard to only show data from the specified document type.
| This filter is not supported by all of the widgets. |
To filter by document type, press the filters button like the image below shows.
On the newly open sidebar you will be able to select a document type by writing the type of document that we want.

The user can click the text field and a selector will be displayed to select the document type (the user can also write the type of document regardless of if it is listed or not).

After writing the desired document type, press the apply filters button.
Now the dashboard will only show data relative to that document type, you can see if a filter is applied by the filters chip that appear below the filter button at the top right corner of the dashboard.

Partition Filter
This filter modifies the user’s perspective on the data. Rather than observing the data in its entirety, it allows the user to examine how the data evolves within a defined time frame.
| This filter is not supported by all of the widgets. |
| In some widgets, you will only be able to view the partitioned data in fullscreen mode. |
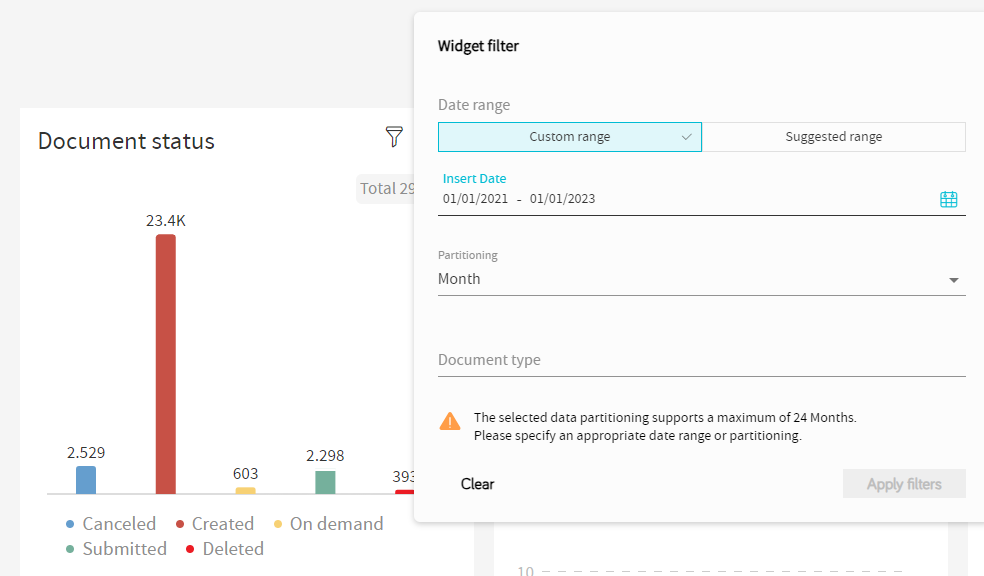
To filter by partition, press the filters button like the image below shows.

On the newly open sidebar you will be able to select a partition.
After selecting the desired partition, press the apply filters button.
| The partitioning options can only be applied in specific date ranges (Ex: Year can only be applied in a date range of 2 years). If the you select an invalid date range for the data partitioning, an error will be displayed explaining the right date range for each partitioning. |

Now the dashboard will only show data relative to that partition, you can see if a filter is applied by the filters chip.

| Partitioning can be different depending on the widget, if you want to see how it works specifically check each widget’s documentation for more information |
If the time frame contains more entries than can be displayed within the widget, navigation arrows will appear in the top-left corner of the widget.
Widget Filter
Using this method only the widget on which this is used, will have the data change.
| If this method is used the widget will override any dashboard filters of the same type. |
Date Filter
This filter will restrict the date shown on the dashboard to the specified date interval.
To filter a specific widget by date the user needs to first open the filter menu by clicking on the filter icon.
By default the user can select a default option or can go to "Custom Range" and pick a custom date range by opening the calendar.
By opening the Calendar the user can select a date range of their choice.

On the other hand, the user can select from predetermined date ranges by selecting presets.

After selecting a date press apply, the widget data should now be updated according to the filter.
| The user can tell that a widget has a filter applied by the badge on the filter icon. |
Partitioning Filter
This filter modifies the user’s perspective on the data. Rather than observing the data in its entirety, it allows the user to examine how the data evolves within a defined time frame.
| In some widgets, you will only be able to view the partitioned data in fullscreen mode. |
| Not all widgets have access to this filter |
To filter a specific widget by partitioning the user needs to first open the filter menu by clicking on the filter icon.
Then the user can select the partitioning under the Data Partitioning label.

The user can then select the data partitioning option and apply the filter.

| The user can tell that a widget has a filter applied by the badge on the filter icon. |
| The partitioning options can only be applied in specific date ranges (Ex: Year can only be applied in a date range of 2 years). If the you select an invalid date range for the data partitioning, an error will be displayed explaining the right date range for each partitioning. |
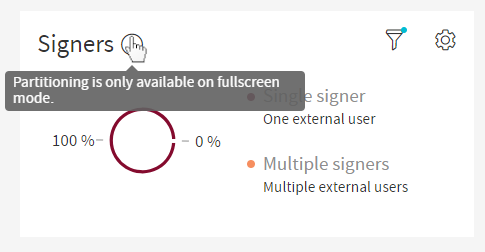
Smaller widgets cannot display partitioned data unless they are in fullscreen, there will be an icon warning the user of this
Simply enter fullscreen and the display will show the data partitioning.
If the time frame contains more entries than can be displayed within the widget, navigation arrows will appear in the top-left corner of the widget.
Document Type Filter
This filter will restrict the statistics on the dashboard to the only show data from the specified document type.
| Not all widgets have access to this filter |
To filter a specific widget by document type the user needs to first open the filter menu by clicking on the filter icon.

Then the user can click on the text field under the Document Type label to display a selector with the document types (the user can also type a document type even if it isn’t one of the options in the selector).

The user can then select the document type and apply the filter.

| The user can tell that a widget has a filter applied by the badge on the filter icon. |
Refreshing Widget Data
The user can refresh the data of the statistics shown by pressing the refresh icon on the dashboard toolbar.
After pressing the icon every widget show goes to a loading state and refreshes the data shown.
Download Usage Data
Allowed users will be able to download Usage Data from the eSign platform.
To do so the user needs to click the download icon on the download toolbar.
After a bit a modal should pop up, here the user should choose the pretended year for the data download, from the available years on the selector.
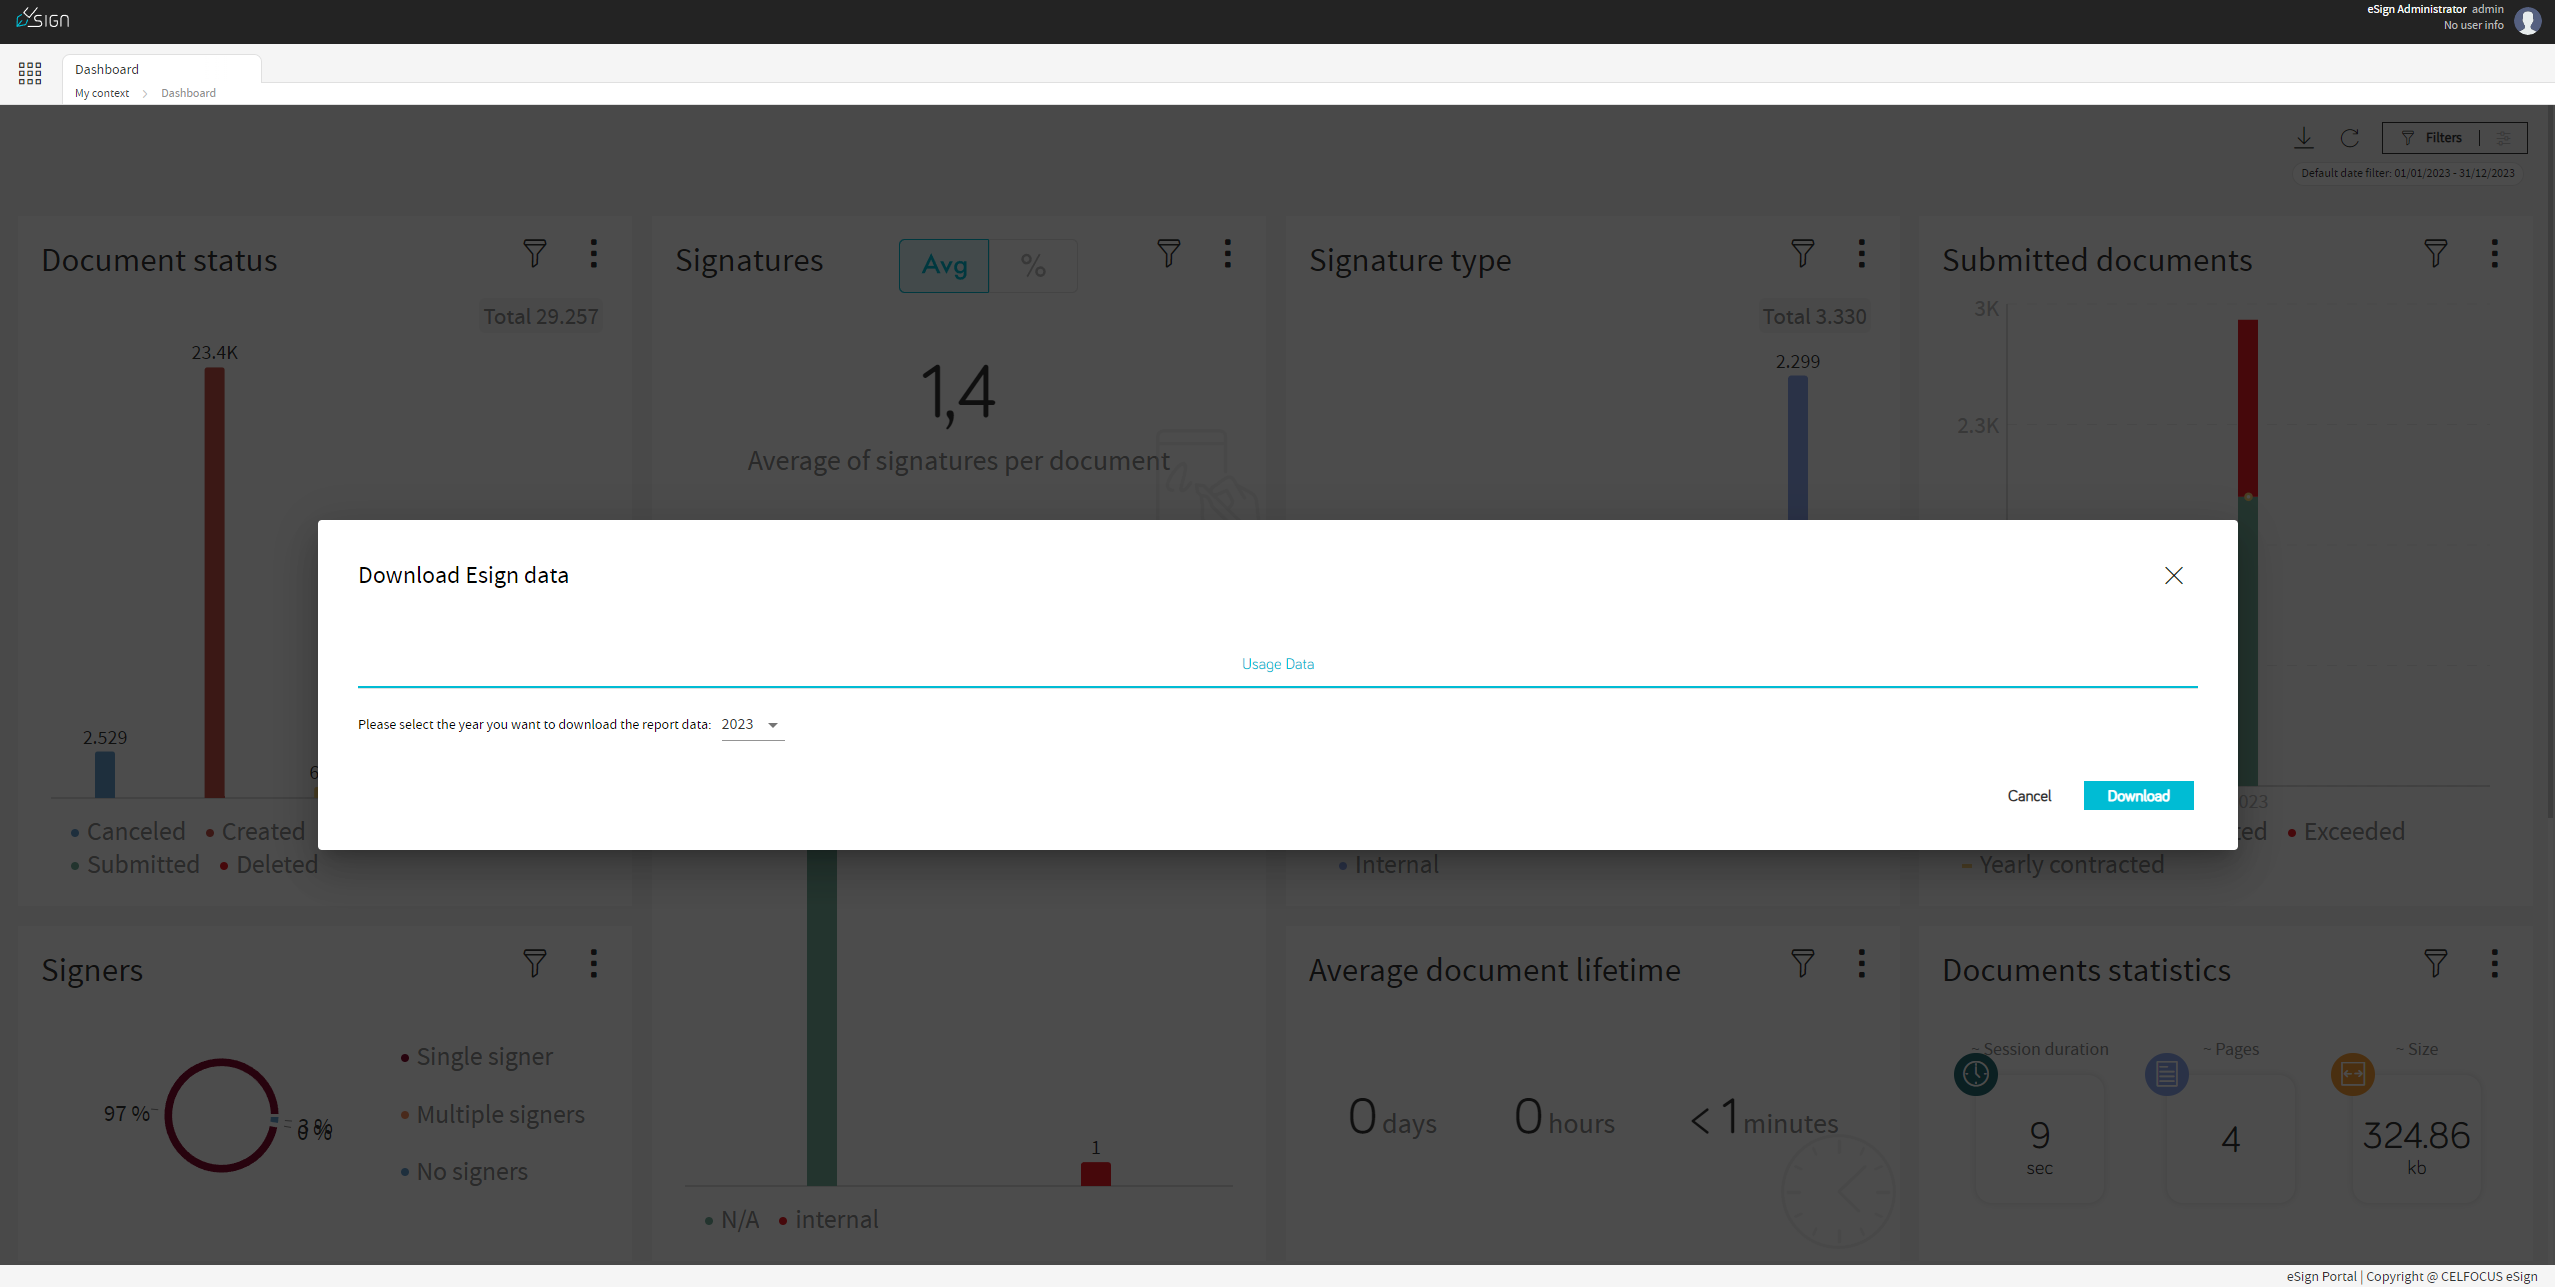
To initialize the download the user needs to press the download button.
After doing so the modal should close and after a while a download should pop up on the browser, in some cases the user may be prompted to allow the website to save files to the pc, if such pop up appears the user should press allow.