Users Widget
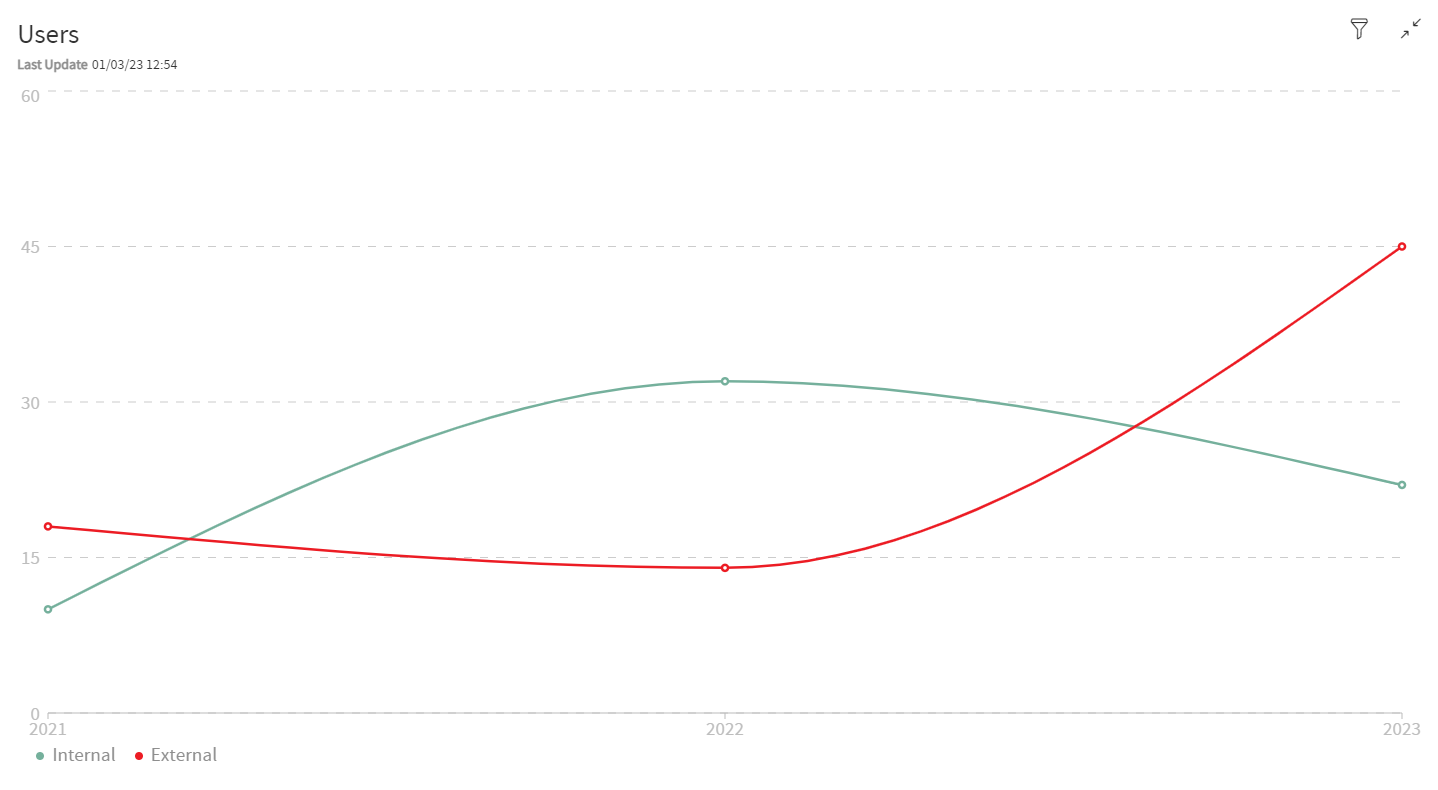
This widget shows the number of users at a specific period in time, for each domain.

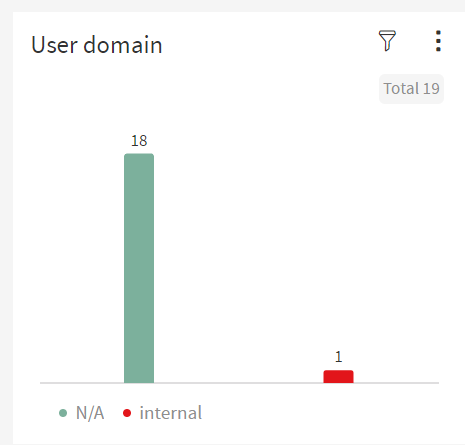
If the graphic contains only a single date point, the widget will display the date in the format of a bar chart.
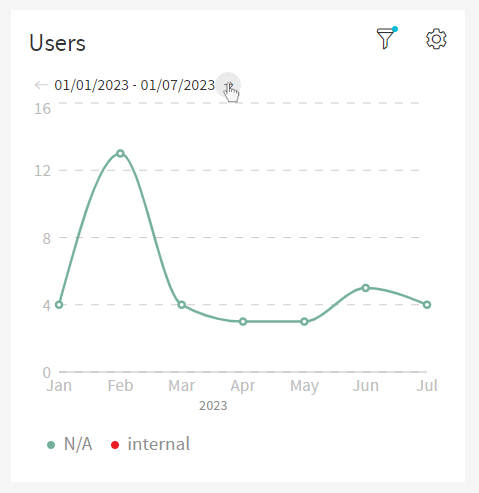
The image above shows the number of user of the current year (default filter)
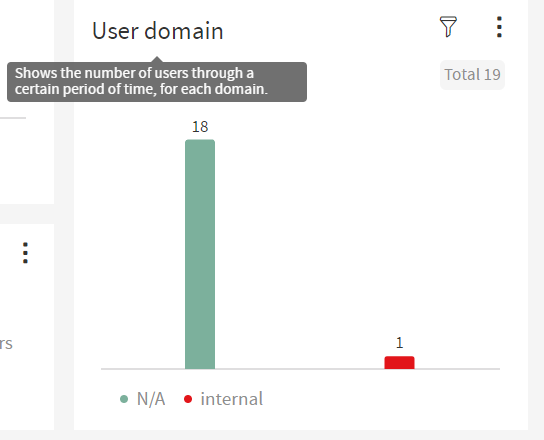
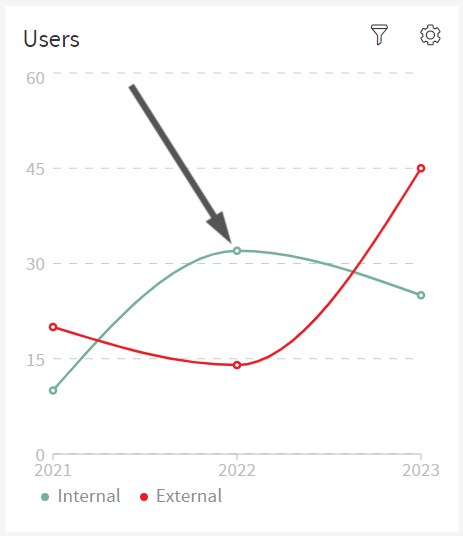
The user can hover the mouse over the title to see a brief explanation of what the widget is.
This widget displays a Line Chart where each line represents the number of users of a specific domain.
On the bottom of the widget there is a legend explaining which line is associated with what domain.
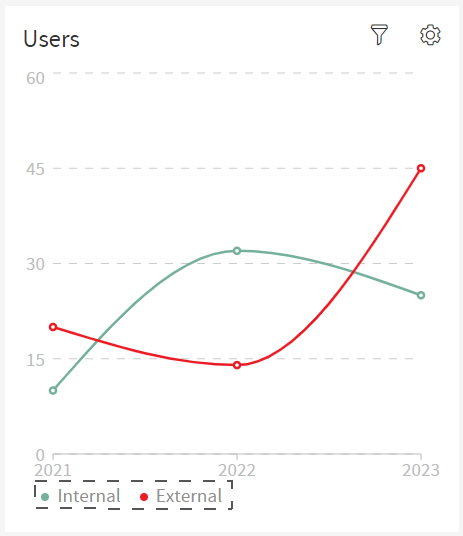
Every line on the Line Chart has dots, each of these dots represents the number of users in a selected period in time.
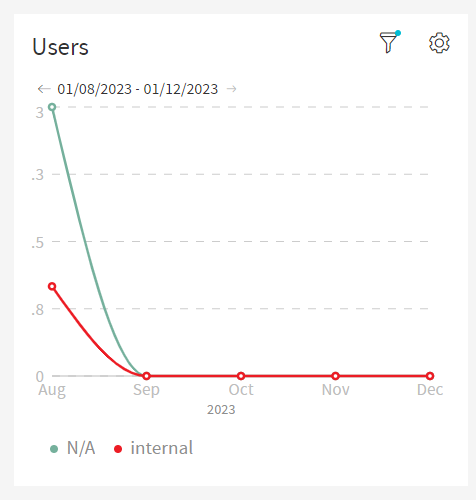
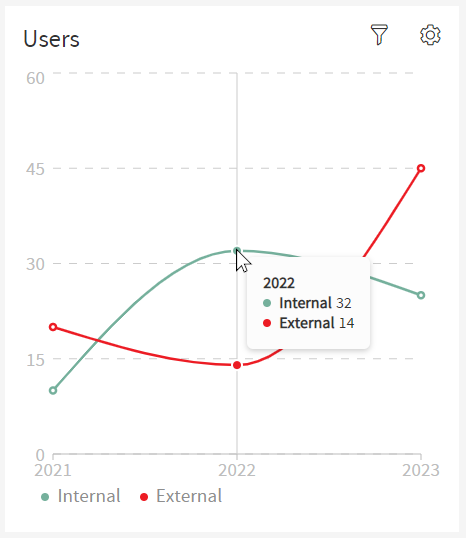
The user can hover over these dots to display a tooltip with the exact number of users of each domain associated with that date period. Hovering will also create a vertical line going through the dot and it will fill the inside of the dot to further accentuate the option the user is selecting.
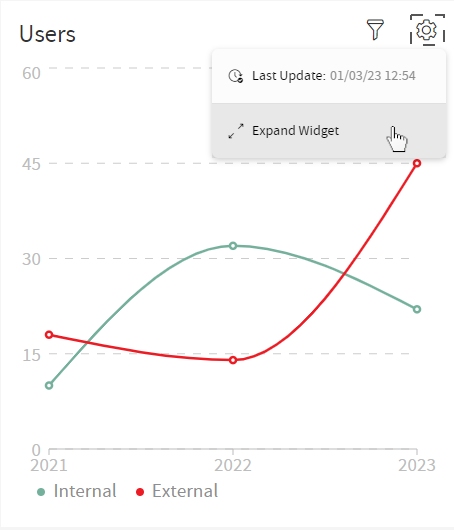
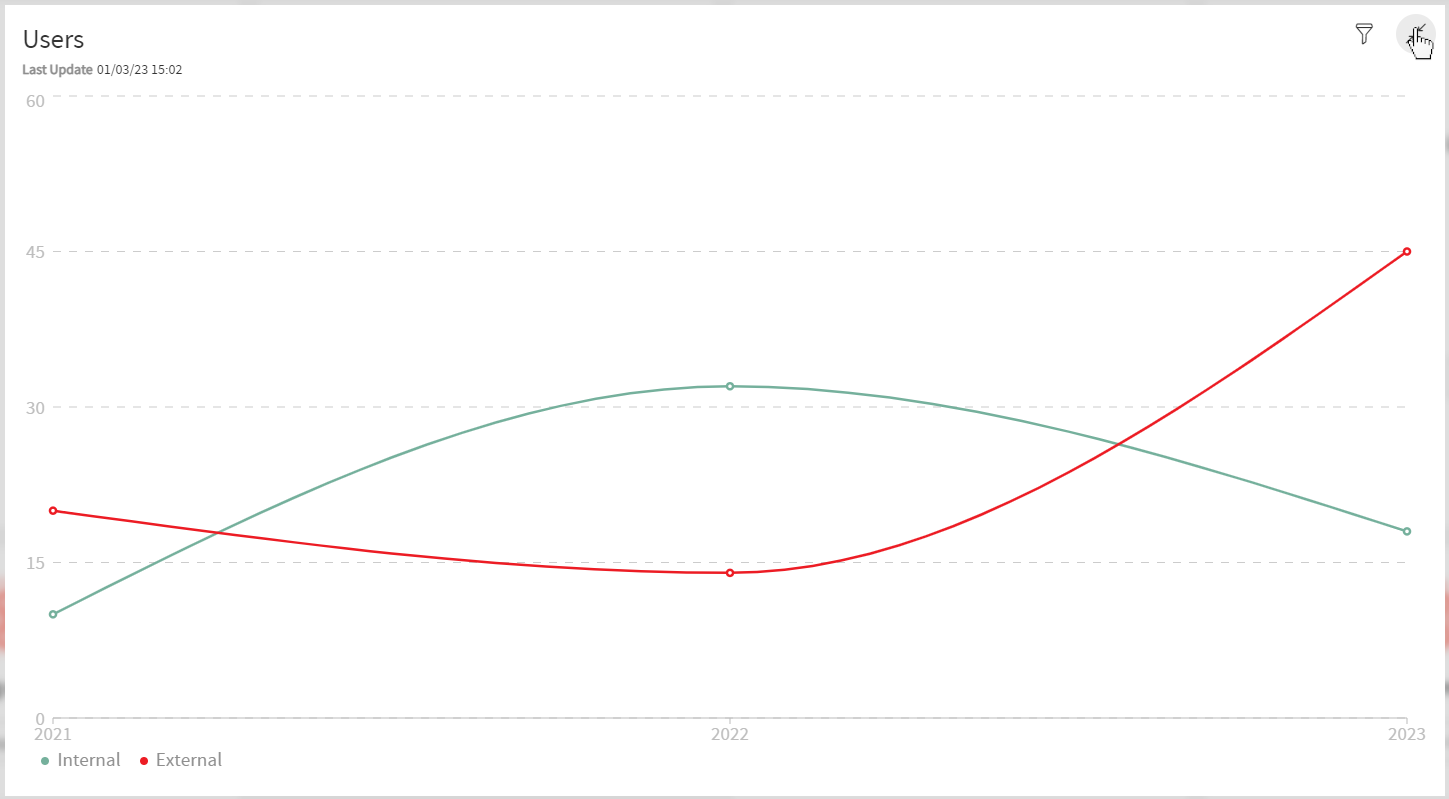
To enter fullscreen, click on the cog wheel on the top right of the widget and you’ll enter a settings menu, here click on the option that says "Expand Widget".
When the widget is in fullscreen, it displays the information in this way.
To return to default view, click the icon on the top right to exit fullscreen.
Partitioning
when a widget as a partition that has too much data to display on the widget, there are arrows on the top left of the widget that allow the user to see the rest of the data by clicking said arrows.