Users Widget
This widget shows the number of users at a specific period in time, for each domain.

Figure 1. Users Widget
This widget displays a Line Chart where each line represents the number of users of a specific domain.
On the bottom of the widget there is a legend explaining which line is associated with what domain.
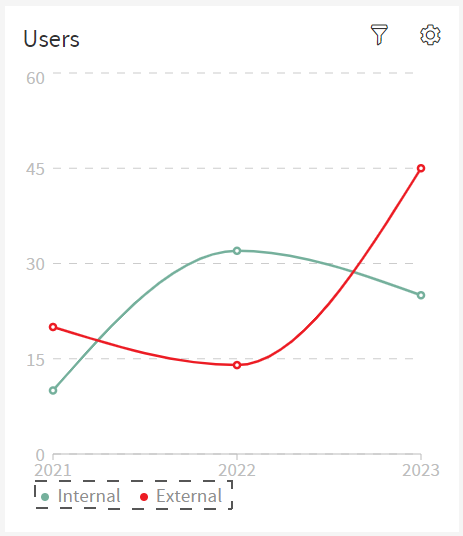
Figure 2. Users Legend
Every line on the Line Chart has dots, each of these dots represents the number of users in a selected period in time.
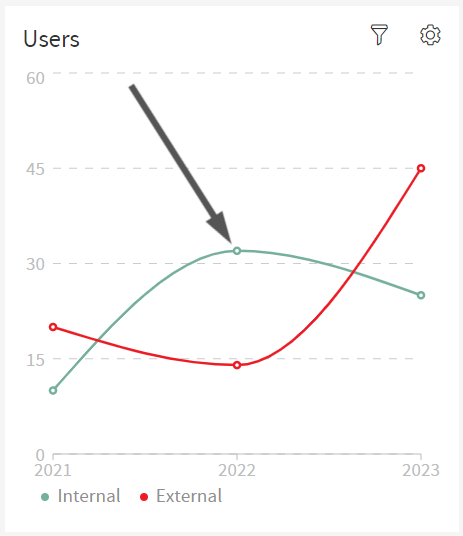
Figure 3. Users Line Chart Dots
The user can hover over these dots to display a tooltip with the exact number of users of each domain associated with that date period. Hovering will also create a vertical line going through the dot and it will fill the inside of the dot to further accentuate the option the user is selecting.
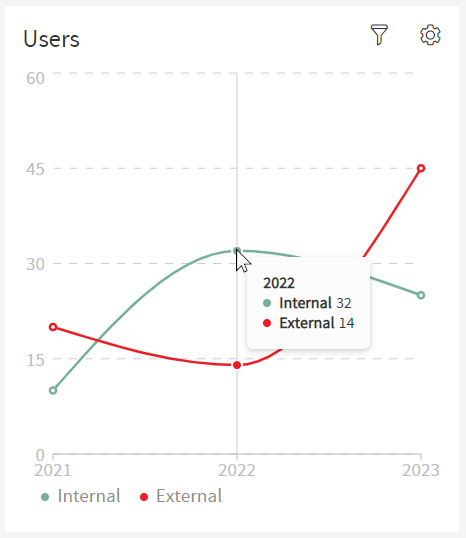
Figure 4. Users Selected Date Period