Submitted Documents Widget
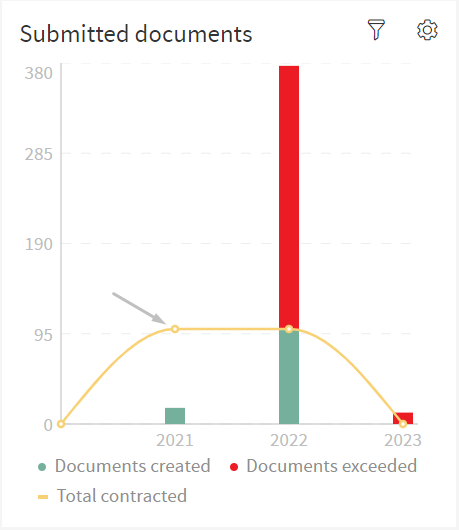
This widget shows the number of contracted documents per year, as well as the number of documents used.
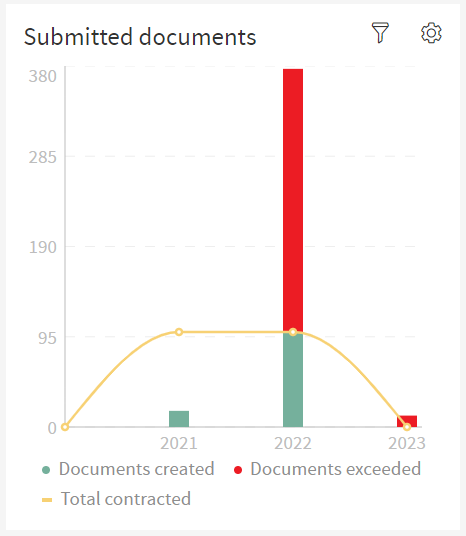
This widget has both a Bar Chart and a Line Chart combined to display its information. The Bar Chart illustrates the number of documents used, while the Line Chart shows the total amount of documents.
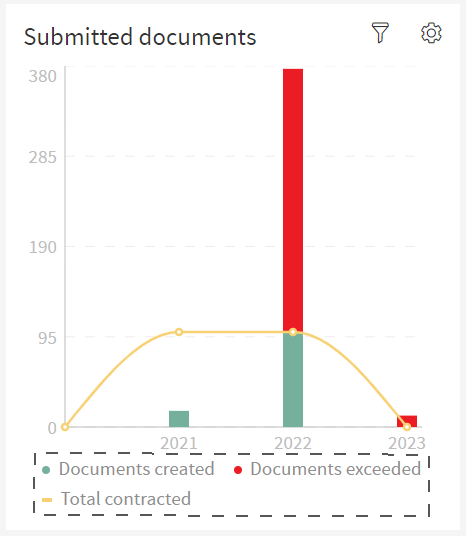
At the bottom of the widget, there is a legend explaining what each element of the chart means.
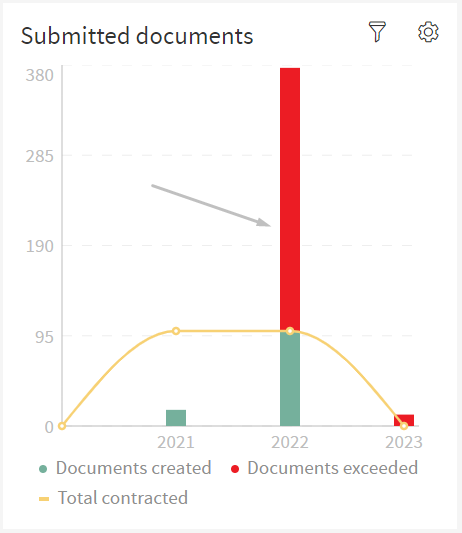
The bars on the chart represent the amount of documents created and exceeded, only if a bar goes past the line, does it mean there are exceeded documents, this will create a stacked bar.
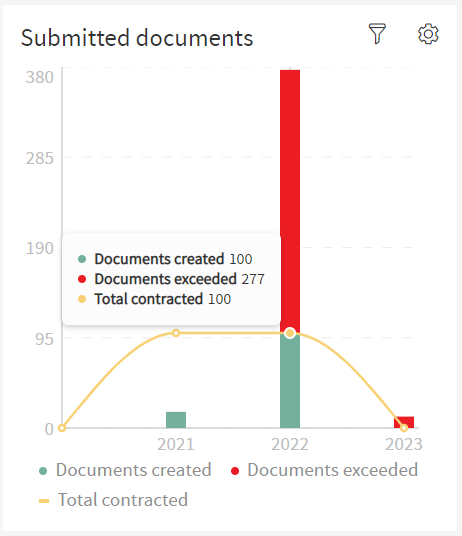
The line on the Chart has dots, each of these dots represents the total number contracted in a selected period in time.
The user can hover over these dots to display a tooltip with the exact number of documents created, documents exceeded and total contracted associated with that date period. Hovering will also create a vertical line going through the dot and it will fill the inside of it to further accentuate the option the user is selecting.