Volume channel Widget
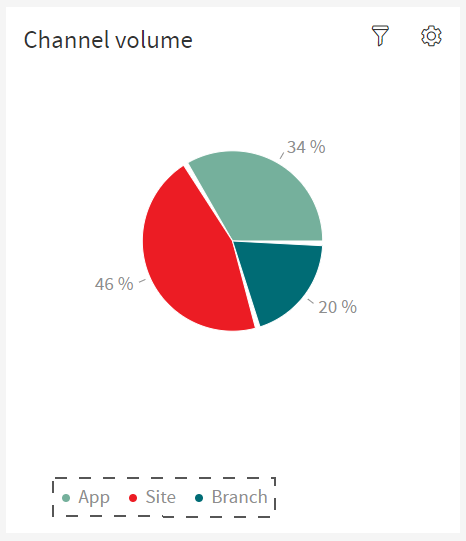
This widget shows the percentage of documents per available channel.

Figure 1. Volume Widget
This widget displays a Pie Chart where each slice represents the number of documents from a specific channel.
On the bottom of the widget there is a legend explaining what each colored slice of the Pie Chart represents.

Figure 2. Volume Legend
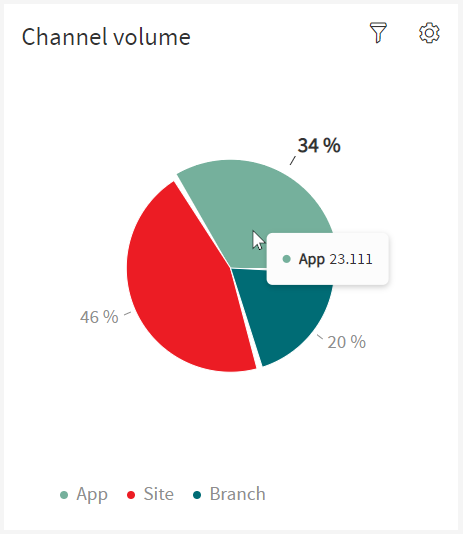
The user can hover over the slices to display a tooltip with the exact number of documents associates with that slice’s channel. Hovering will also increase the size of the slice and turn the percentage text into bold to further accentuate the option the user is selecting.

Figure 3. Volume Hover Over Pie Chart