Volume channel Widget
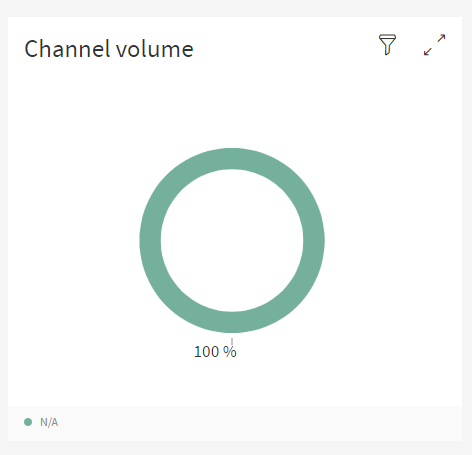
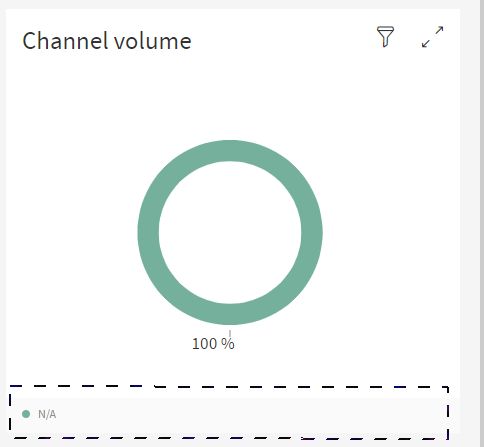
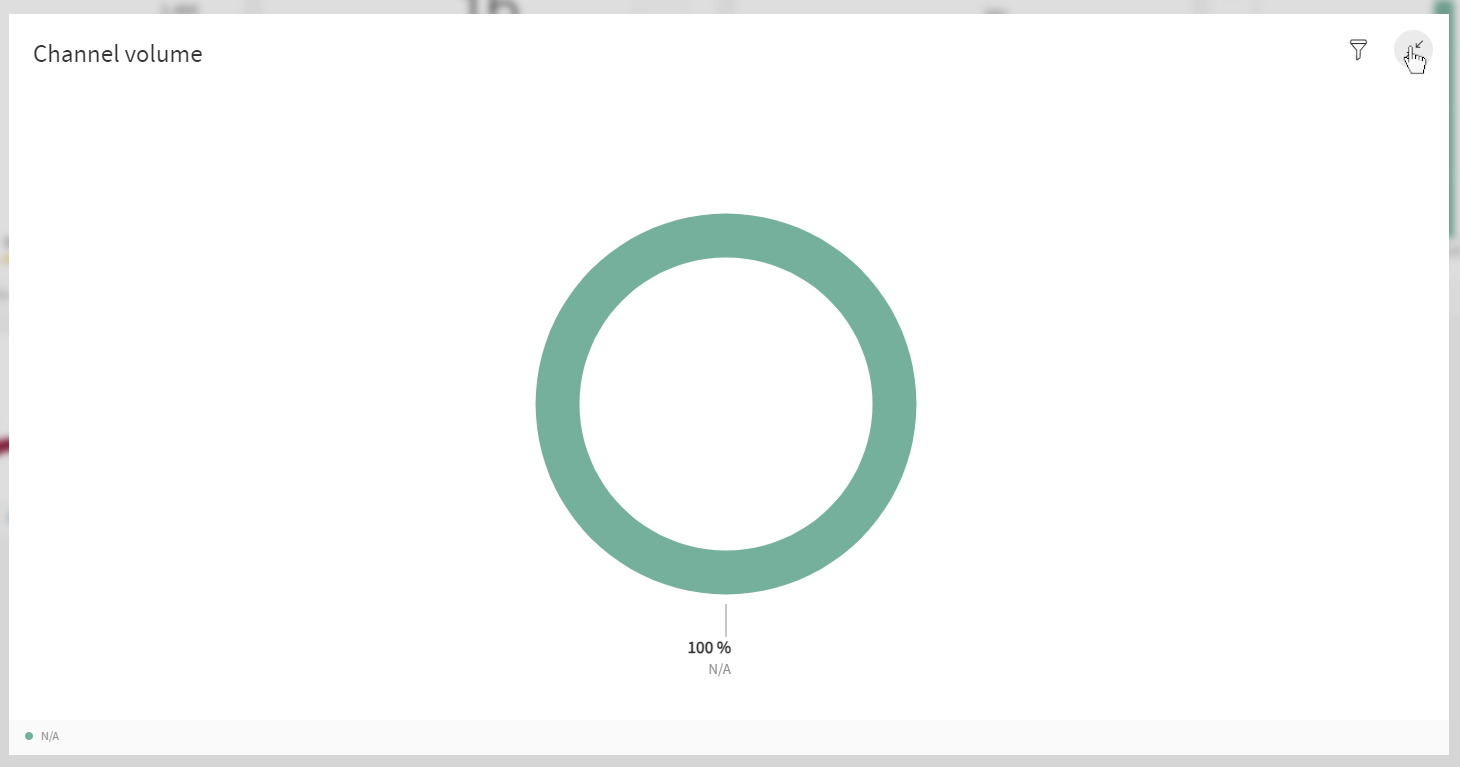
This widget displays a Pie Chart where each slice represents the number of documents from a specific channel.
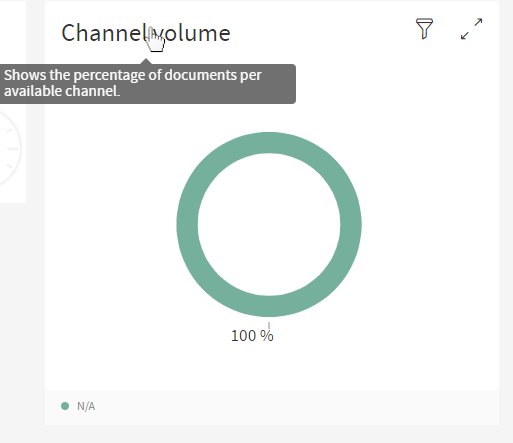
The user can hover the mouse over the title to see a brief explanation of what the widget is.
On the bottom of the widget there is a legend explaining what each colored slice of the Pie Chart represents.
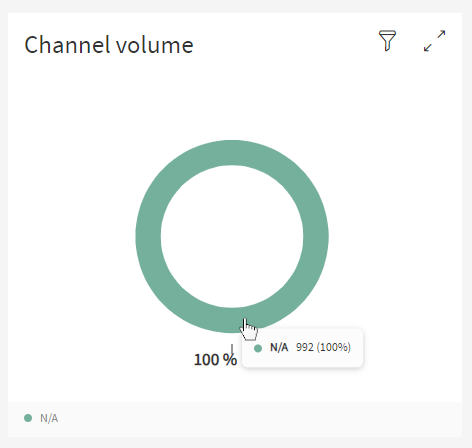
The user can hover over the slices to display a tooltip with the exact number of documents associates with that slice’s channel. Hovering will also increase the size of the slice and turn the percentage text into bold to further accentuate the option the user is selecting.
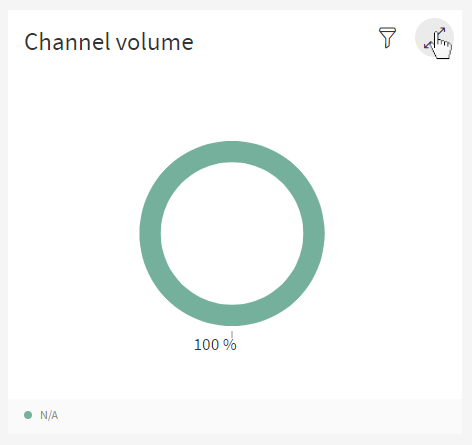
To enter fullscreen, click on the cog wheel on the top right of the widget and you’ll enter a settings menu, here click on the option that says "Expand Widget".
When the widget is in fullscreen, it displays the information in this way.
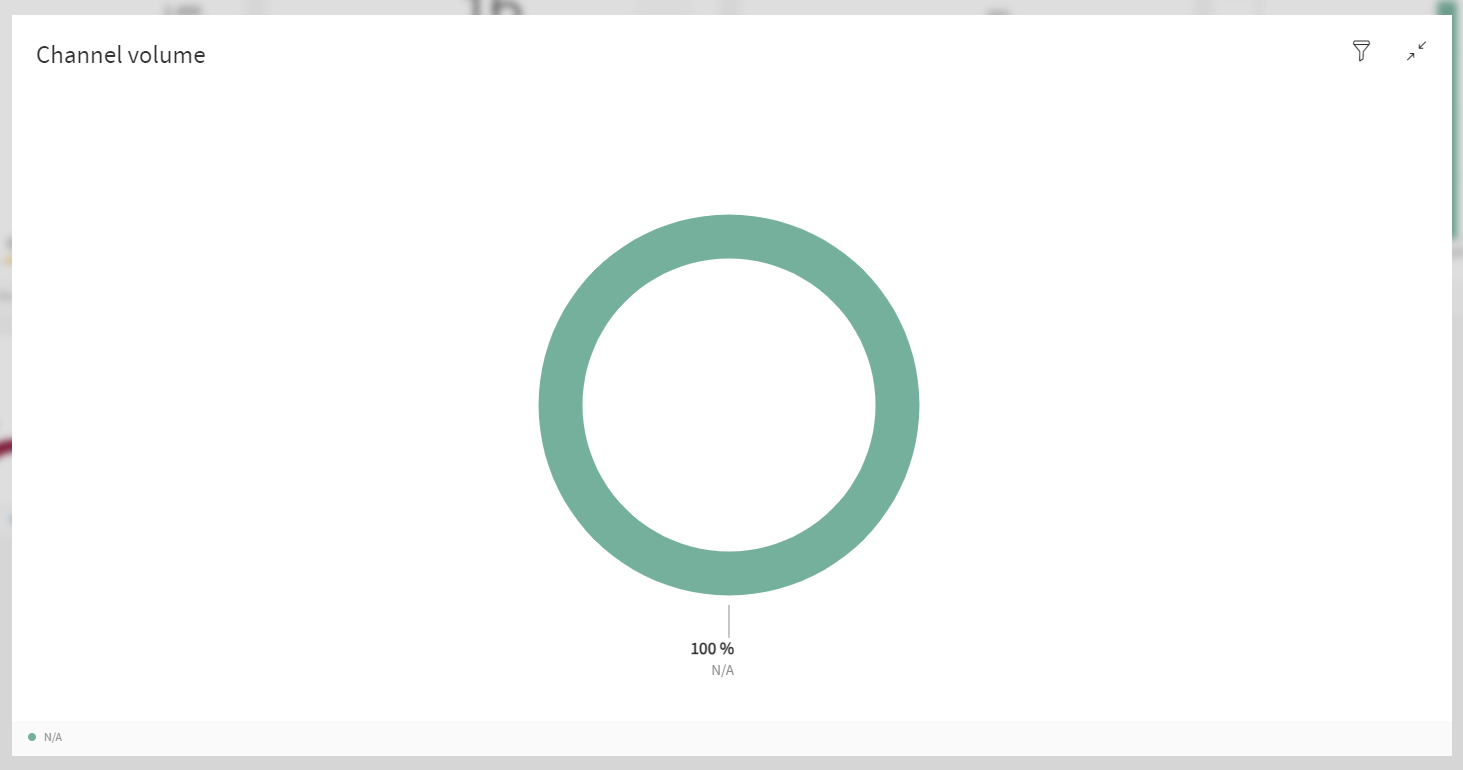
To return to default view, click the icon on the top right to exit fullscreen.
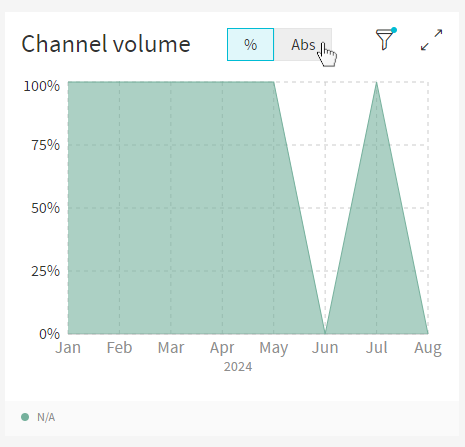
Partitioning
By default, the widget will display an AreaChart when a partitioning is selected (In this case, the partition of Month with the default date range has been applied).
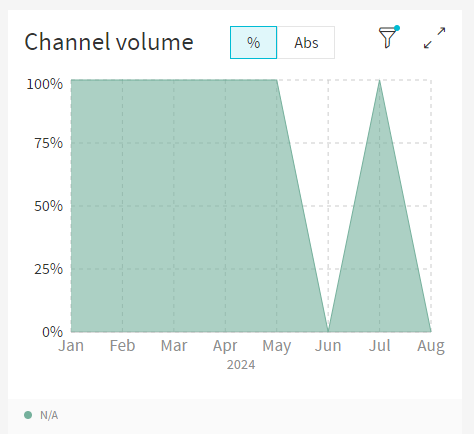
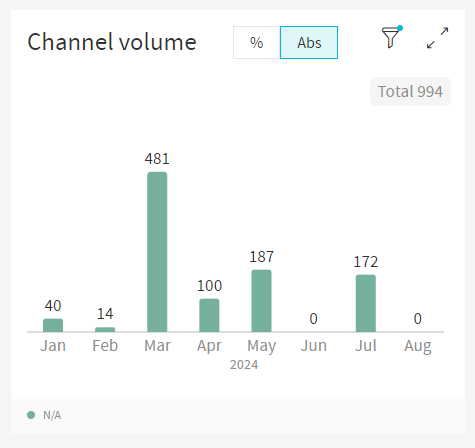
You can change the type of chart displayed by the widget by changing the view on the selector menu on the top